Visualizing Common Customer Service Requests: Unveiling Trends and Frequencies
The primary data source for this dataset corresponds to the customer service requests received by a company dedicated to the sale of clothing. Advisors receive cases and enter the reasons for the customer's call into the system notes. Each person writes differently; however, certain words stand out and are common across all customer service representatives, such as "Voucher" or "Return." The goal of this activity is to identify the most common requests received by customer service representatives and visually represent these requirements. In the first chart, I aimed to highlight the three most prominent types of requests in the previous data exploration: "Return," "Voucher," and "Exchange." The best way to show the frequency of these three requests is through a horizontal bar plot. I chose this format to ensure that the names are visible. I added a title that is consistent, such as "Most Common Customer Services Request." Next to this, I decided to depict the frequency of the two most common requests through a line chart. Initially, I had thought of a title like "Number of petitions for items," but this did not completely reflect what the chart is highlighting: the requests made to customer service agents per day. In this second chart, I retained the colors used in the first chart to allow the end user to make associations, and the lines are different to ensure that even if it is printed in black and white, it can still be identified. The title is bigger to capture the attention and it is concise reflecting the primary idea of the graphic. he title is larger to capture attention and is concise, reflecting the primary idea of the graphic. The text next to the lines is sufficiently large, aiding users in easily identifying the corresponding type of request. Initially, I labeled the X-axis as "Classification" for the bar chart, but I changed it to "Types of Requests" for clarity.
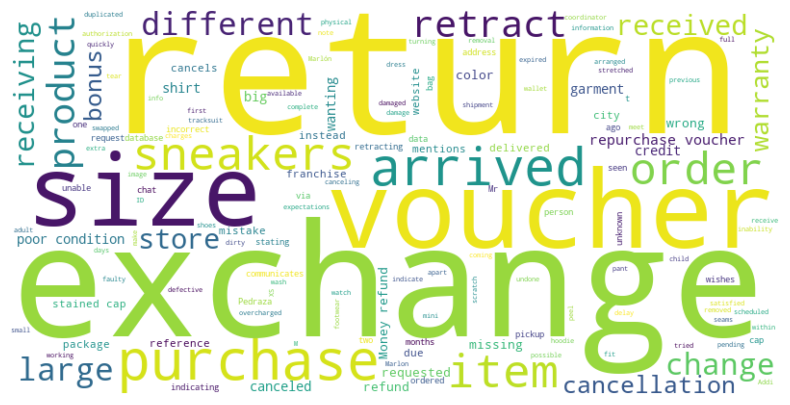
Below, I will present the word cloud generated over the entire dataset. To create this, I had to eliminate very common words used by advisors, such as "Customer," or verbs like "Desire" and "Request," as they hindered the identification of genuine requests. This word cloud displays the three categories previously highlighted as the most prominent.
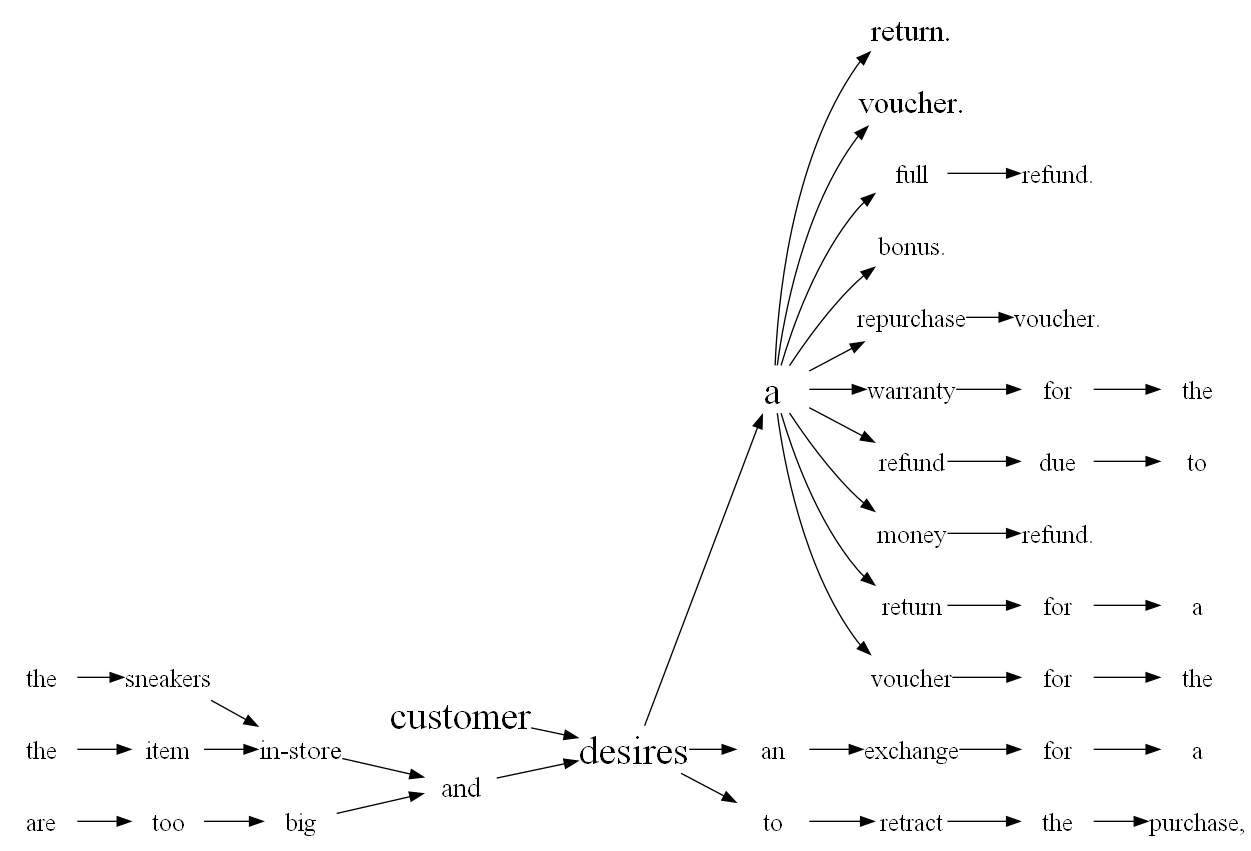
Finally, I identified that the most frequently used term by advisors to describe customer requests is "Desires." This discovery prompted me to create a "Word Tree" that facilitates the easy identification of requests received by advisors. These align with the earlier findings of Return, Voucher, and Exchange, but additional common terms emerge, such as Warranty and Refund. This specific graph holds significant value for the organization as it could streamline the automated handling of these frequent requests. In other words, it could establish a portal where individuals can manage returns and exchanges without needing to contact an advisor.
Moreover, the company should consider integrating a chatbot on its website or customer service platform. The chatbot can be trained using the identified patterns to handle common queries, providing instant responses and freeing up human resources for more complex issues. For instance, the system could automatically send information about return procedures or promotions related to frequently mentioned terms like "Warranty" or "Refund."